Underride Crash Maps & Data
Through the Fatality Analysis Reporting System (FARS), the Department of Transportation receives reports from each state on truck crash fatalities. To the best of their ability, they analyze the data and record those deaths which they determine could be labeled as due to “Underride.” That includes the following charts:
Truck Underride Fatalities, 1994-2014, pdf
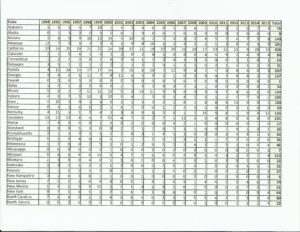
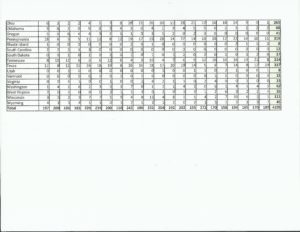
The next chart covers the time period of 1994 to 2015, showing underride deaths when the initial collision was at the front, side, and rear of trailers — first for the country, followed by a similar format for each state. Numbers are shown one year at a time and then totaled:
Passenger Vehicle Underride Fatalities by State, 1994-2015, by NHTSA
We also received a graph of underride deaths by State for 2015 from Matt Brumbelow, Senior Research Engineer at the IIHS. Specifically, these are “2015 Passenger vehicle occupant fatalities in 2-vehicle crashes with tractor-trailers.”
Matt Brumbelow explains further, “that 2015 is still the latest year of data that NHTSA has released. Also, that while not all these crashes will have involved underride, our estimates based on other studies is that underride occurs in 80-90% of tractor-trailer rear and side crashes with serious/fatal injuries.”
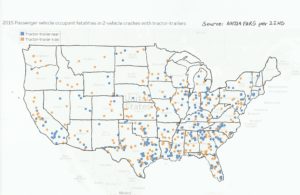
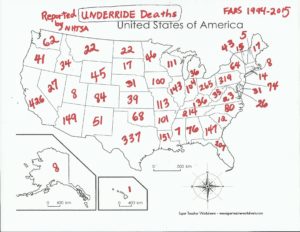
U.S. Map of PV Deaths in Truck Crashes 2015 IIHS
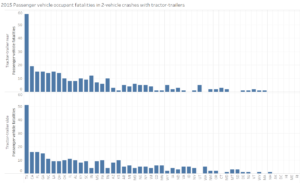
2015 Graph PV Deaths in Truck Crashes IIHS
IIHS, Passenger vehicle occupant deaths in 2-vehicle crashes with tractor-trailers, 2005-15
The Insurance Institute for Highway Safety prepared this graph by state: PV Fatalities in Truck Crashes 2015 per IIHS
The next map of the U.S. shows the number of underride deaths reported by NHTSA in the FARS by state. Find out how your state fares on truck underride deaths from 1994 through 2015:
By State Underride Deaths & Petition Signers 27%
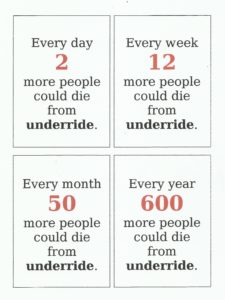
No one needs to die this way.
History of Underride Research & Reports (flipsnack book)
History of Underride Research & Reports: 1896 to 2017